
IPAC Transaction Count December 2017
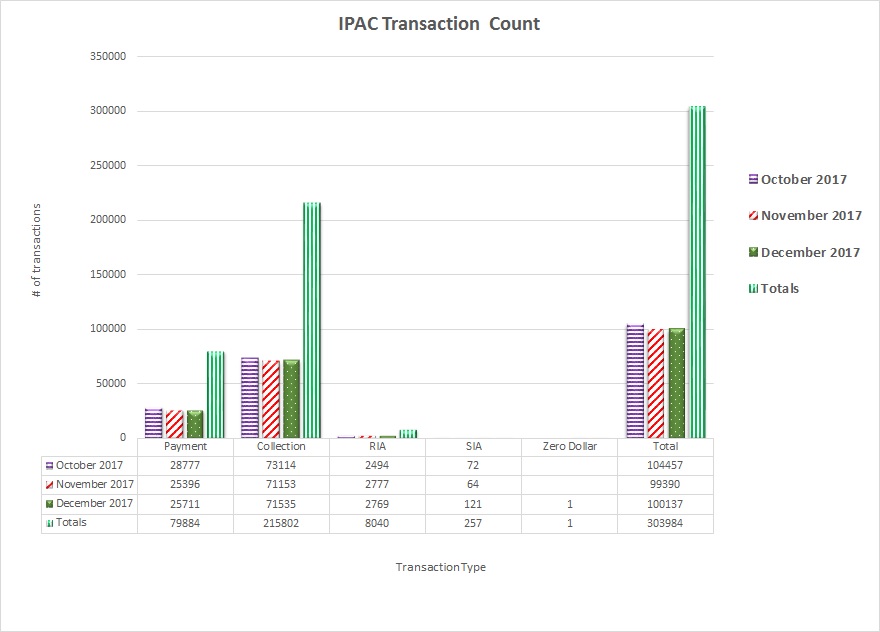
Table may scroll on smaller screens
| Date | Payment | Collection | RIA | SIA | Zero Dollar | Total |
| October 2017 | 28,777 | 73,114 | 2,494 | 72 | 104,457 | |
| November 2017 | 25,396 | 71,153 | 2,777 | 64 | 99,390 | |
| December 2017 | 25,711 | 71,535 | 2,769 | 121 | 1 | 100,137 |
| Totals | 79,884 | 215,802 | 8,040 | 257 | 1 | 303,984 |