
IPAC Transaction Count October/November 2018
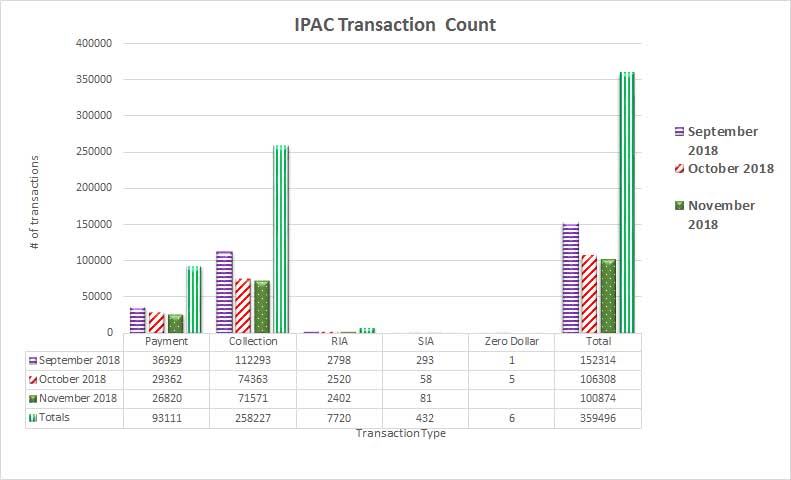
Table may scroll on smaller screens
| Date | Payment | Collection | RIA | SIA | Zero Dollar | Total |
|---|---|---|---|---|---|---|
| September 2018 | 36,929 | 112,293 | 2,798 | 293 | 1 | 152,314 |
| October 2018 | 29,362 | 74,363 | 2,520 | 58 | 5 | 106,308 |
| November 2018 | 26,820 | 71,571 | 2,402 | 81 | 100,874 | |
| Totals | 93,111 | 258,227 | 7,720 | 432 | 6 | 359,496 |