
IPAC Transaction Count April 2019
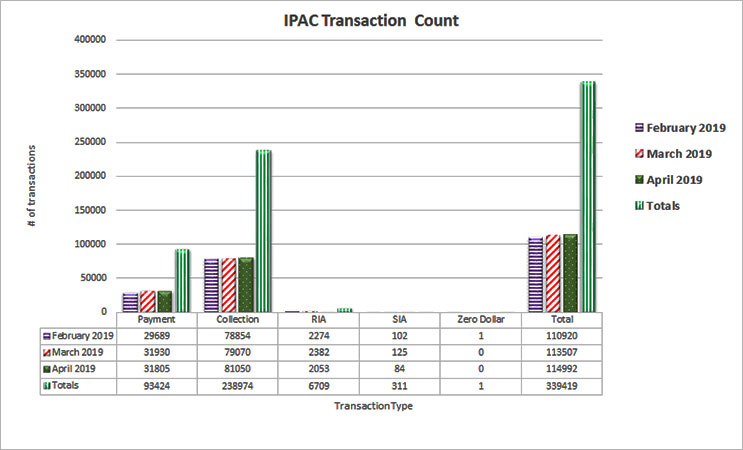
Table may scroll on smaller screens
| Date | Payment | Collection | RIA | SIA | Zero Dollar | Total |
|---|---|---|---|---|---|---|
| February 2019 | 29,689 | 78,854 | 2,274 | 102 | 1 | 110,920 |
| March 2019 | 31,930 | 79,070 | 2,382 | 125 | - | 113,507 |
| April 2019 | 31,805 | 81,050 | 2,053 | 84 | - | 114,992 |
| Totals | 93,424 | 238,974 | 6,709 | 311 | 1 | 339,419 |