
IPAC Transaction Count March 2019
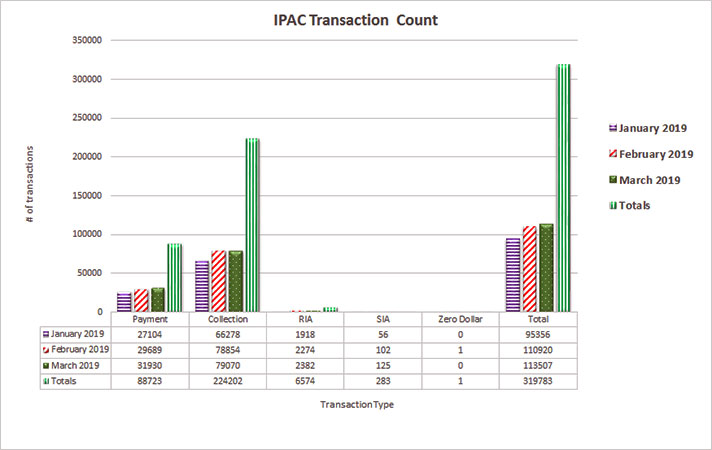
Table may scroll on smaller screens
| Date | Payment | Collection | RIA | SIA | Zero Dollar | Total |
|---|---|---|---|---|---|---|
| January 2019 | 27,104 | 66,278 | 1,918 | 56 | - | 95,356 |
| February 2019 | 29,689 | 78,854 | 2,274 | 102 | 1 | 110,920 |
| March 2019 | 31,930 | 79,070 | 2,382 | 125 | - | 113,507 |
| Totals | 88,723 | 224,202 | 6,574 | 283 | 1 | 319,783 |