
IPAC Transaction Count January 2019
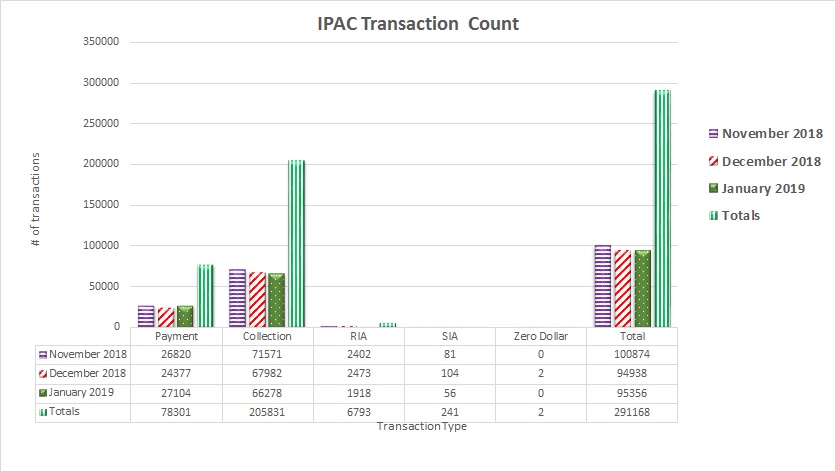
Table may scroll on smaller screens
| Date | Payment | Collection | RIA | SIA | Zero Dollar | Total |
| November 2018 | 26,820 | 71,571 | 2,402 | 81 | 0 | 100,874 |
| December 2018 | 24,377 | 67,982 | 2,473 | 104 | 2 | 94,938 |
| January 2019 | 27,104 | 66,278 | 1,918 | 56 | 0 | 95,356 |
| Totals | 78,301 | 205,831 | 6,793 | 241 | 2 | 291,168 |