
IPAC Transaction Count December 2024
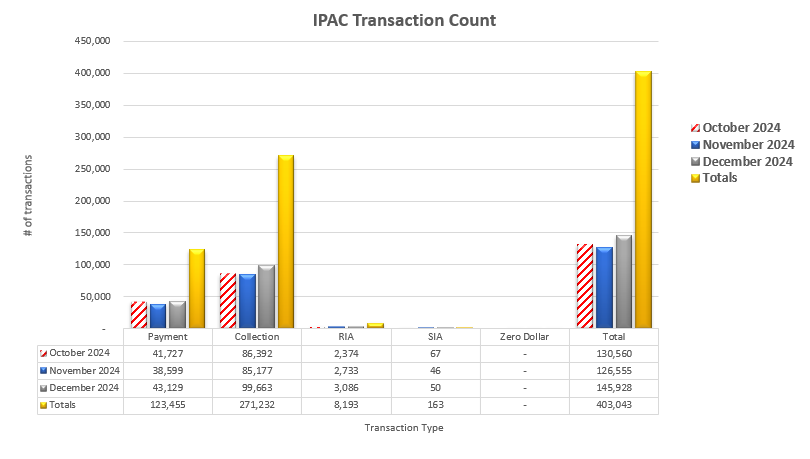
Table may scroll on smaller screens
| Date | Payment | Collection | RIA | SIA | Zero Dollar | Total |
|---|---|---|---|---|---|---|
| October 2024 | 41,727 | 86,392 | 2,374 | 67 | - | 130,560 |
| November 2024 | 38,599 | 85,177 | 2,733 | 46 | - | 126,555 |
| December 2024 | 43,129 | 99,663 | 3,086 | 50 | - | 145,928 |
| Totals | 123,455 | 271,232 | 8,193 | 163 | - | 403,043 |