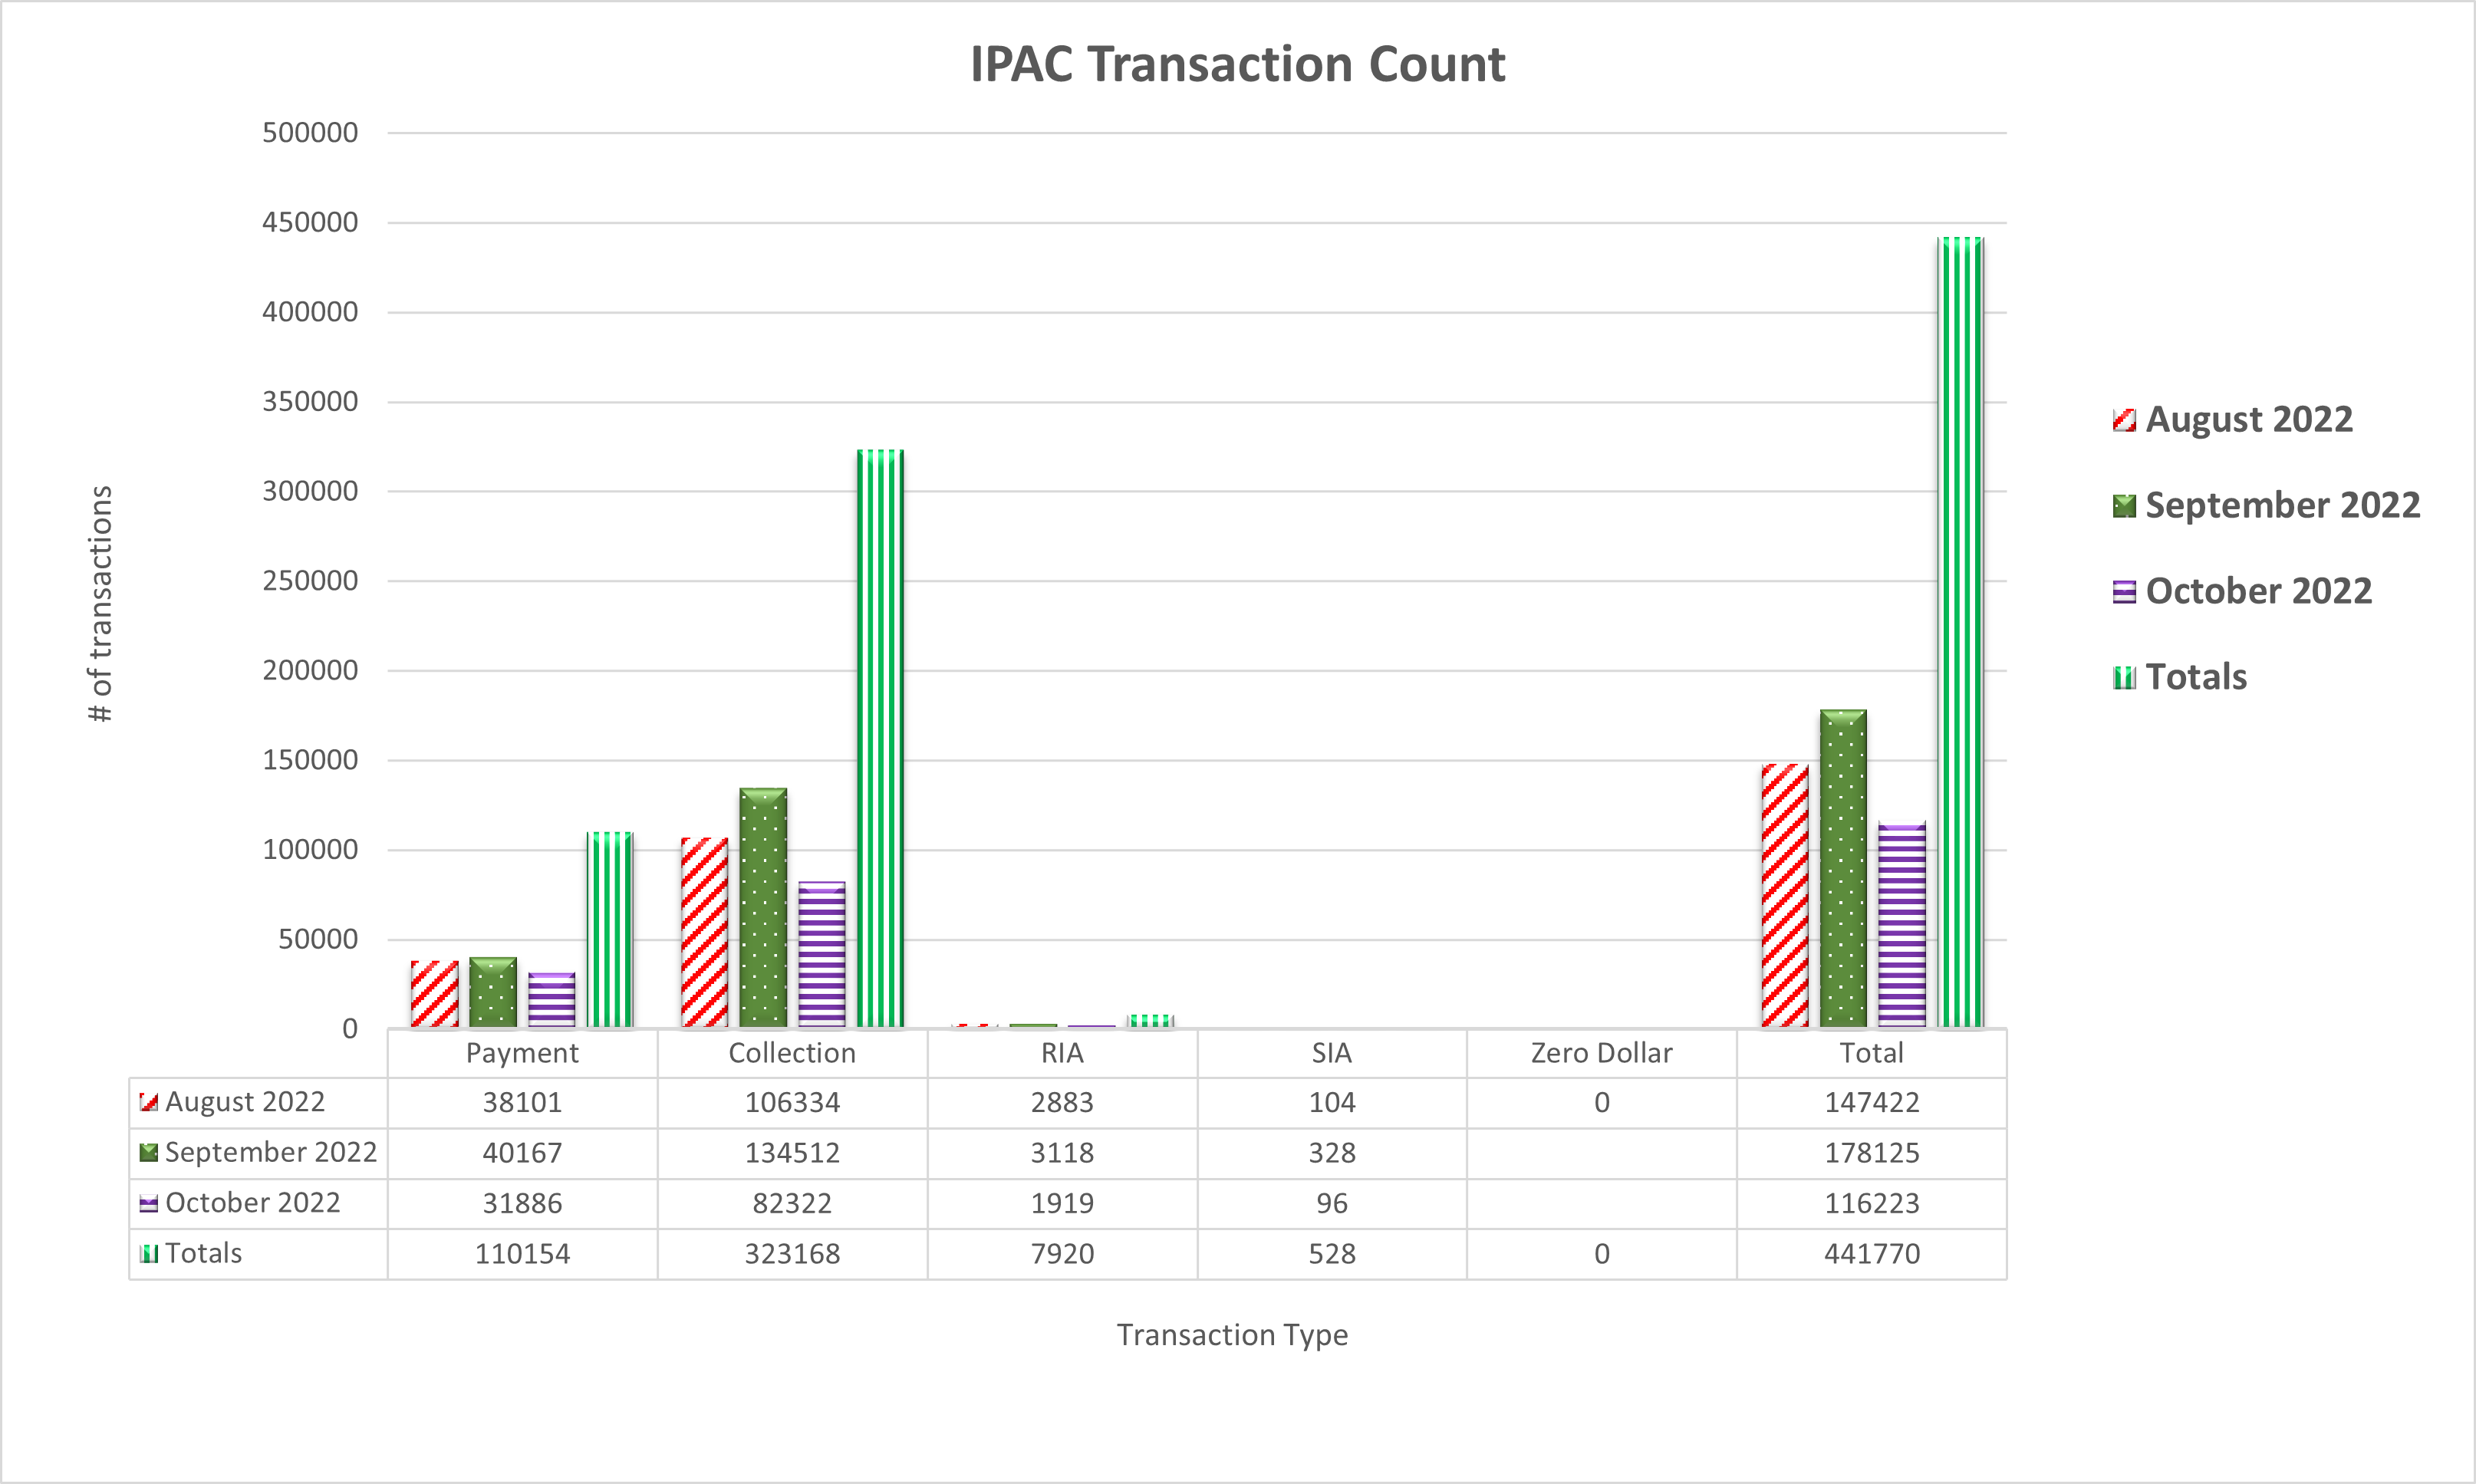
IPAC Transaction Count October 2022

Table may scroll on smaller screens
| Date | Payment | Collection | RIA | SIA | Zero Dollar | Total |
|---|---|---|---|---|---|---|
| August 2022 | 38,101 | 106,334 | 2,883 | 104 | - | 147,422 |
| September 2022 | 40,167 | 134,512 | 3,118 | 328 | 178,125 | |
| October 2022 | 31,886 | 82,322 | 1,919 | 96 | 116,223 | |
| Totals | 110,154 | 323,168 | 7,920 | 528 | - | 441,770 |
