
IPAC Transaction Count October 2021
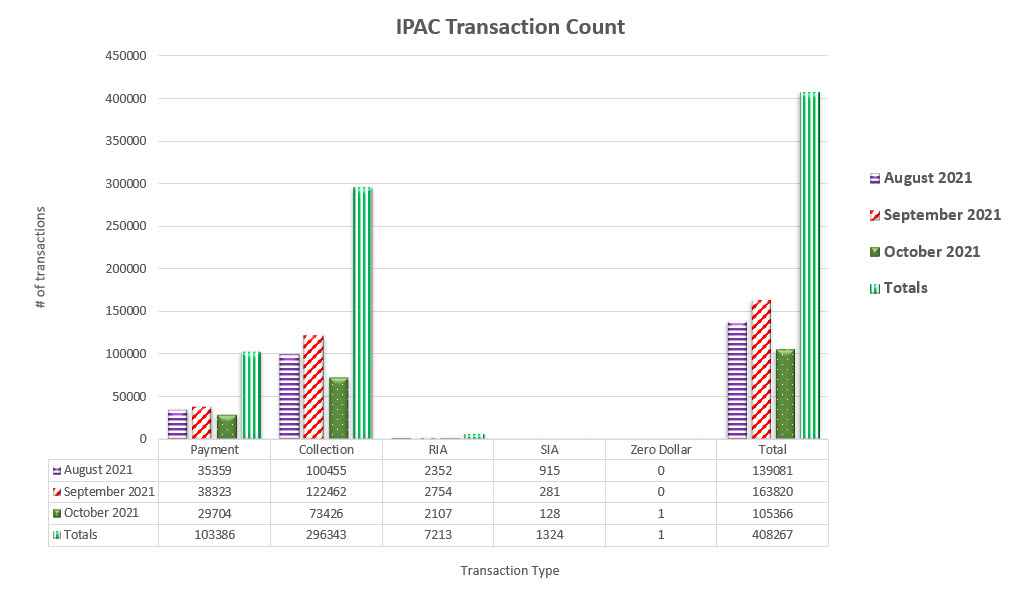
Table may scroll on smaller screens
| Date | Payment | Collection | RIA | SIA | Zero Dollar | Total |
|---|---|---|---|---|---|---|
| August 2021 | 35,359 | 100,455 | 2,352 | 915 | - | 139,081 |
| September 2021 | 38,323 | 122,462 | 2,754 | 281 | - | 163,820 |
| October 2021 | 29,704 | 73,426 | 2,107 | 128 | 1 | 105,366 |
| Totals | 103,386 | 296,343 | 7,213 | 1,324 | 1 | 408,267 |