
IPAC Transaction Count August 2024
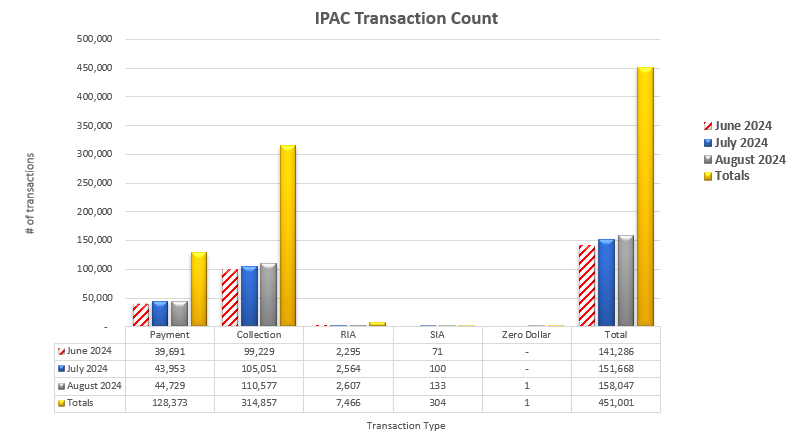
Table may scroll on smaller screens
| Date | Payment | Collection | RIA | SIA | Zero Dollar | Total |
|---|---|---|---|---|---|---|
| June 2024 | 39,691 | 99,229 | 2,295 | 71 | - | 141,286 |
| July 2024 | 43,953 | 105,051 | 2,564 | 100 | - | 151,668 |
| August 2024 | 44,729 | 110,577 | 2,607 | 133 | 1 | 158,047 |
| Totals | 128,373 | 314,857 | 7,466 | 304 | 1 | 451,001 |