
IPAC Transaction Count July 2023
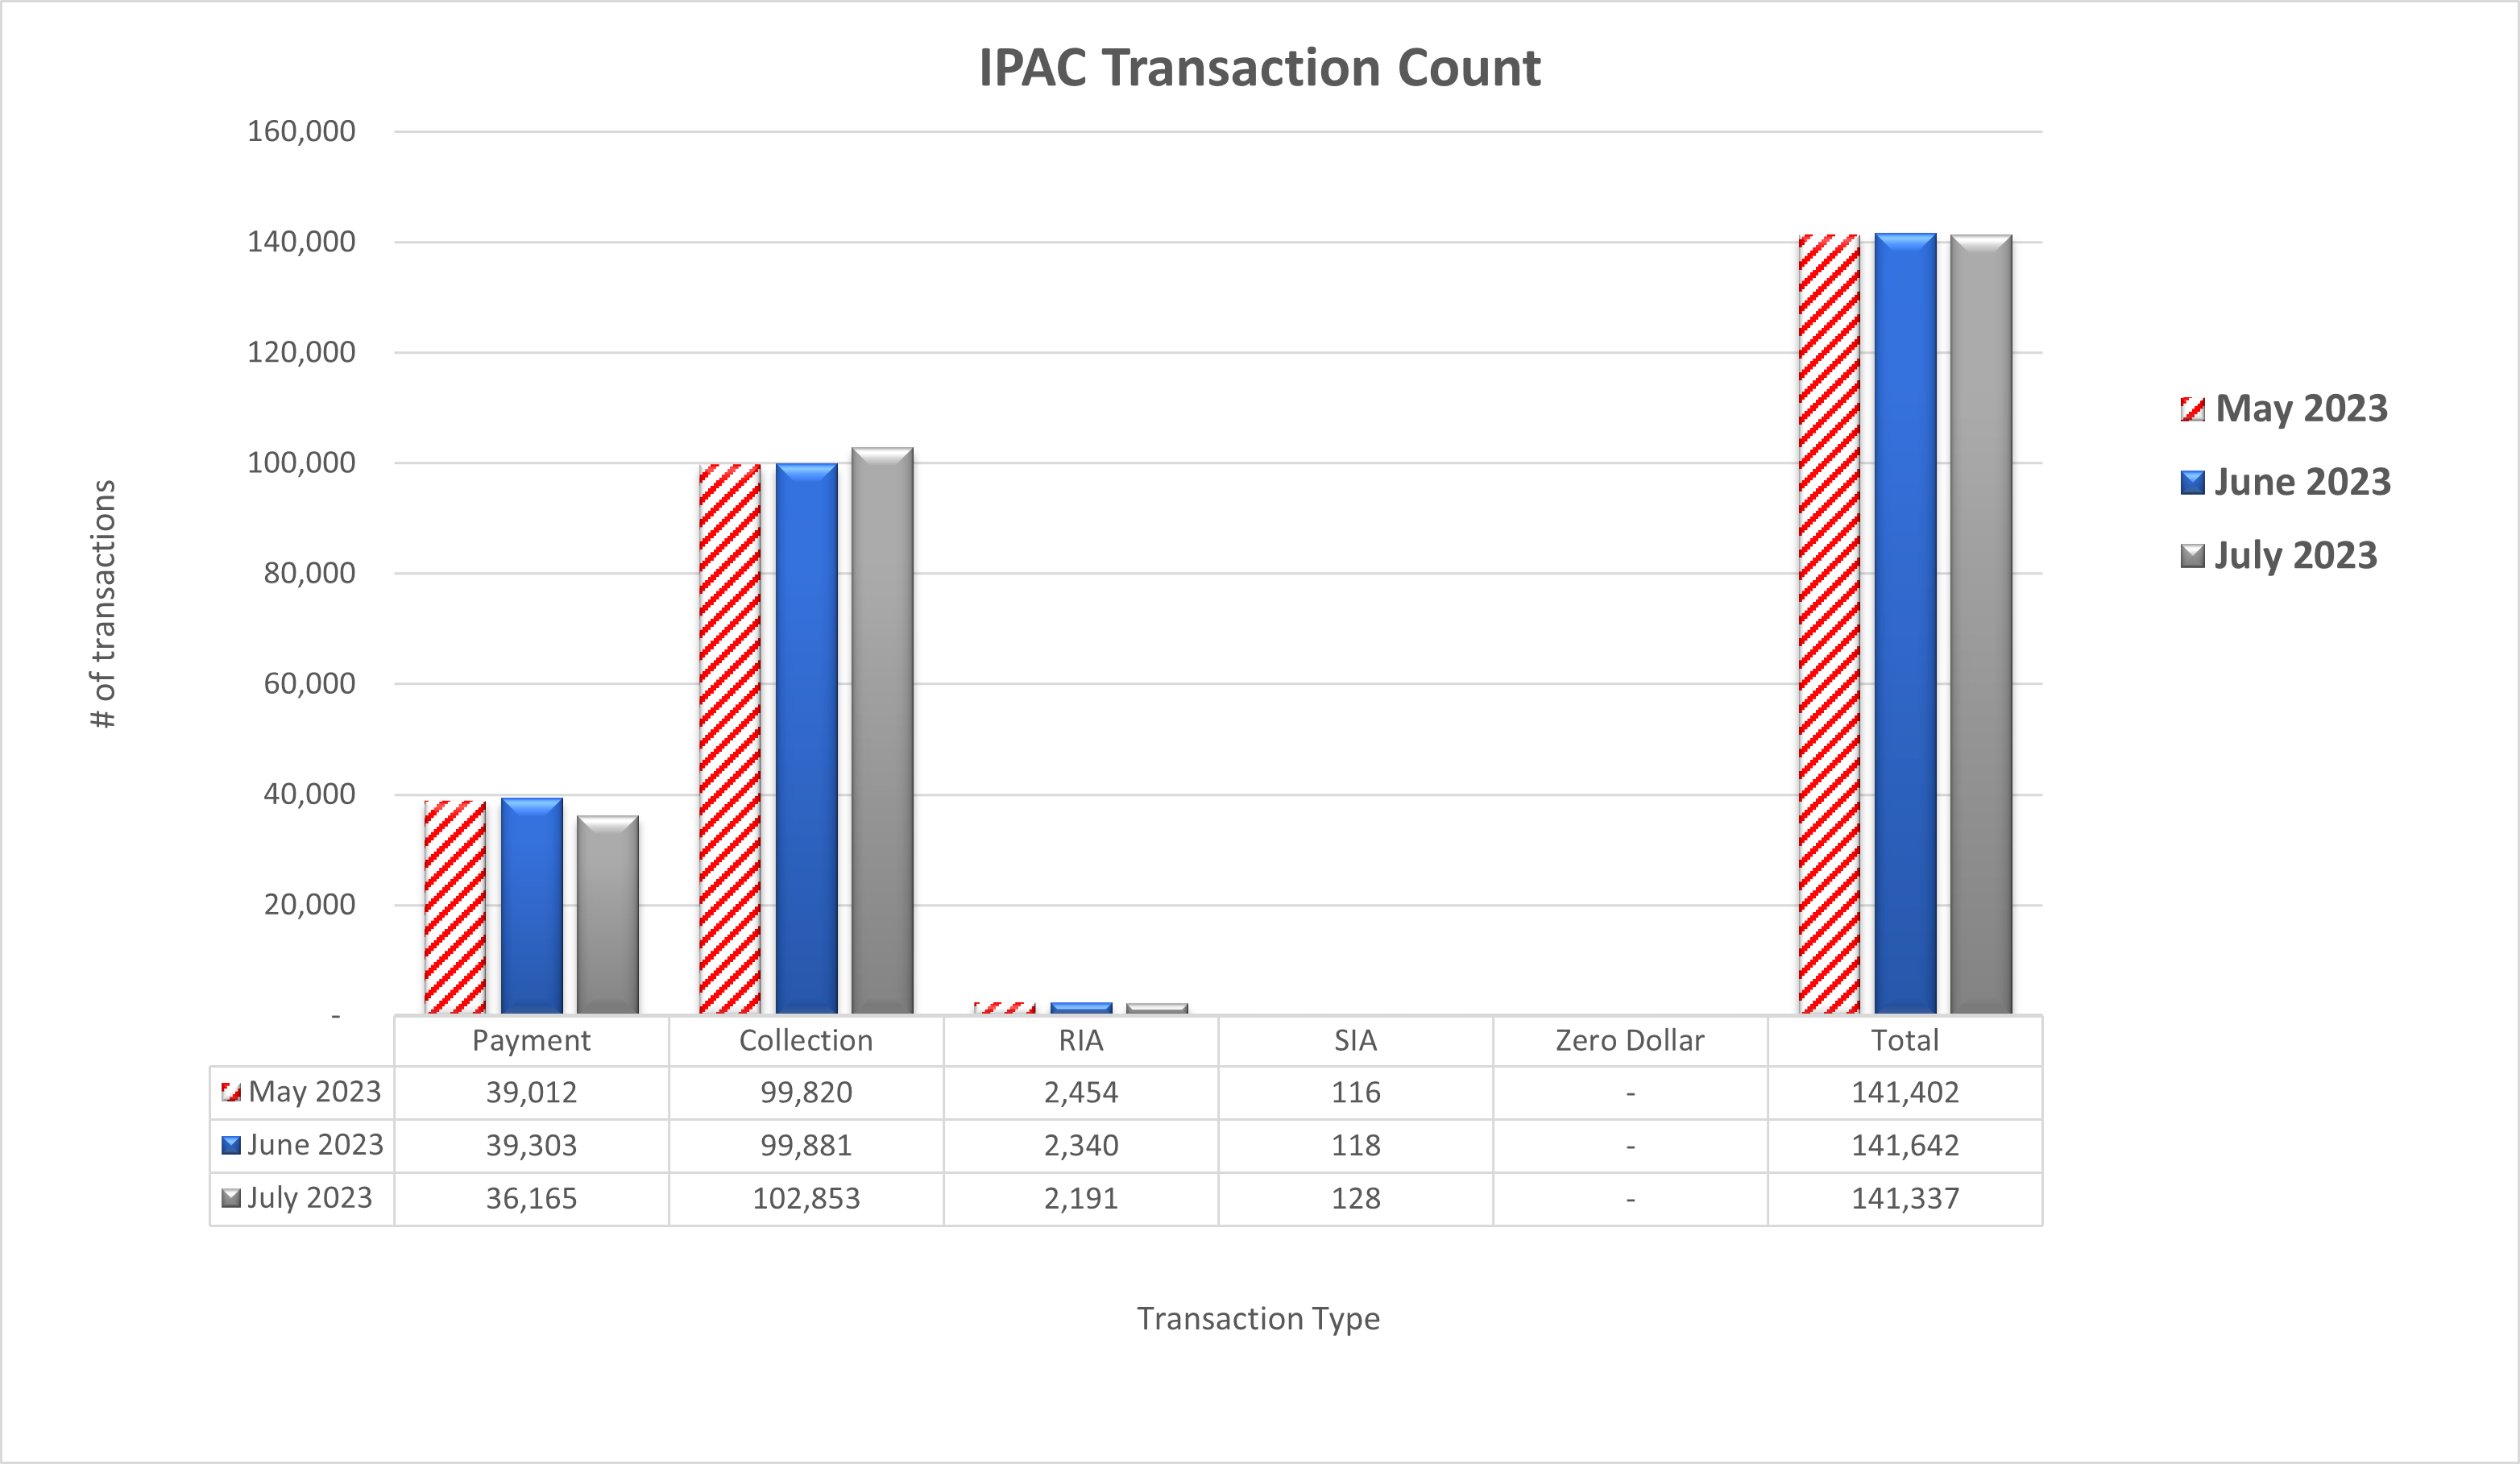
Table may scroll on smaller screens
| Date | Payment | Collection | RIA | SIA | Zero Dollar | Total |
|---|---|---|---|---|---|---|
| May 2023 | 39,012 | 99,820 | 2,454 | 116 | - | 141,402 |
| June 2023 | 39,303 | 99,881 | 2,340 | 118 | - | 141,642 |
| July 2023 | 36,165 | 102,853 | 2,191 | 128 | - | 141,337 |
| Totals | 114,480 | 302,554 | 6,985 | 362 | - | 424,381 |