
IPAC Transaction Count June 2019
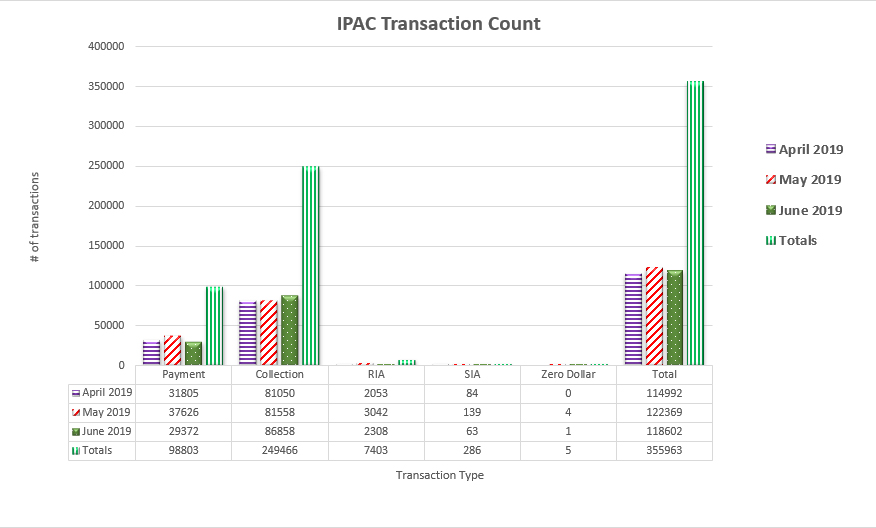
Table may scroll on smaller screens
| Date | Payment | Collection | RIA | SIA | Zero Dollar | Total |
|---|---|---|---|---|---|---|
| April 2019 | 31,805 | 81,050 | 2,053 | 84 | - | 114,992 |
| May 2019 | 37,626 | 81,558 | 3,042 | 139 | 4 | 122,369 |
| June 2019 | 29,372 | 86,858 | 2,308 | 63 | 1 | 118,602 |
| Totals | 98,803 | 249,466 | 7,403 | 286 | 5 | 355,963 |