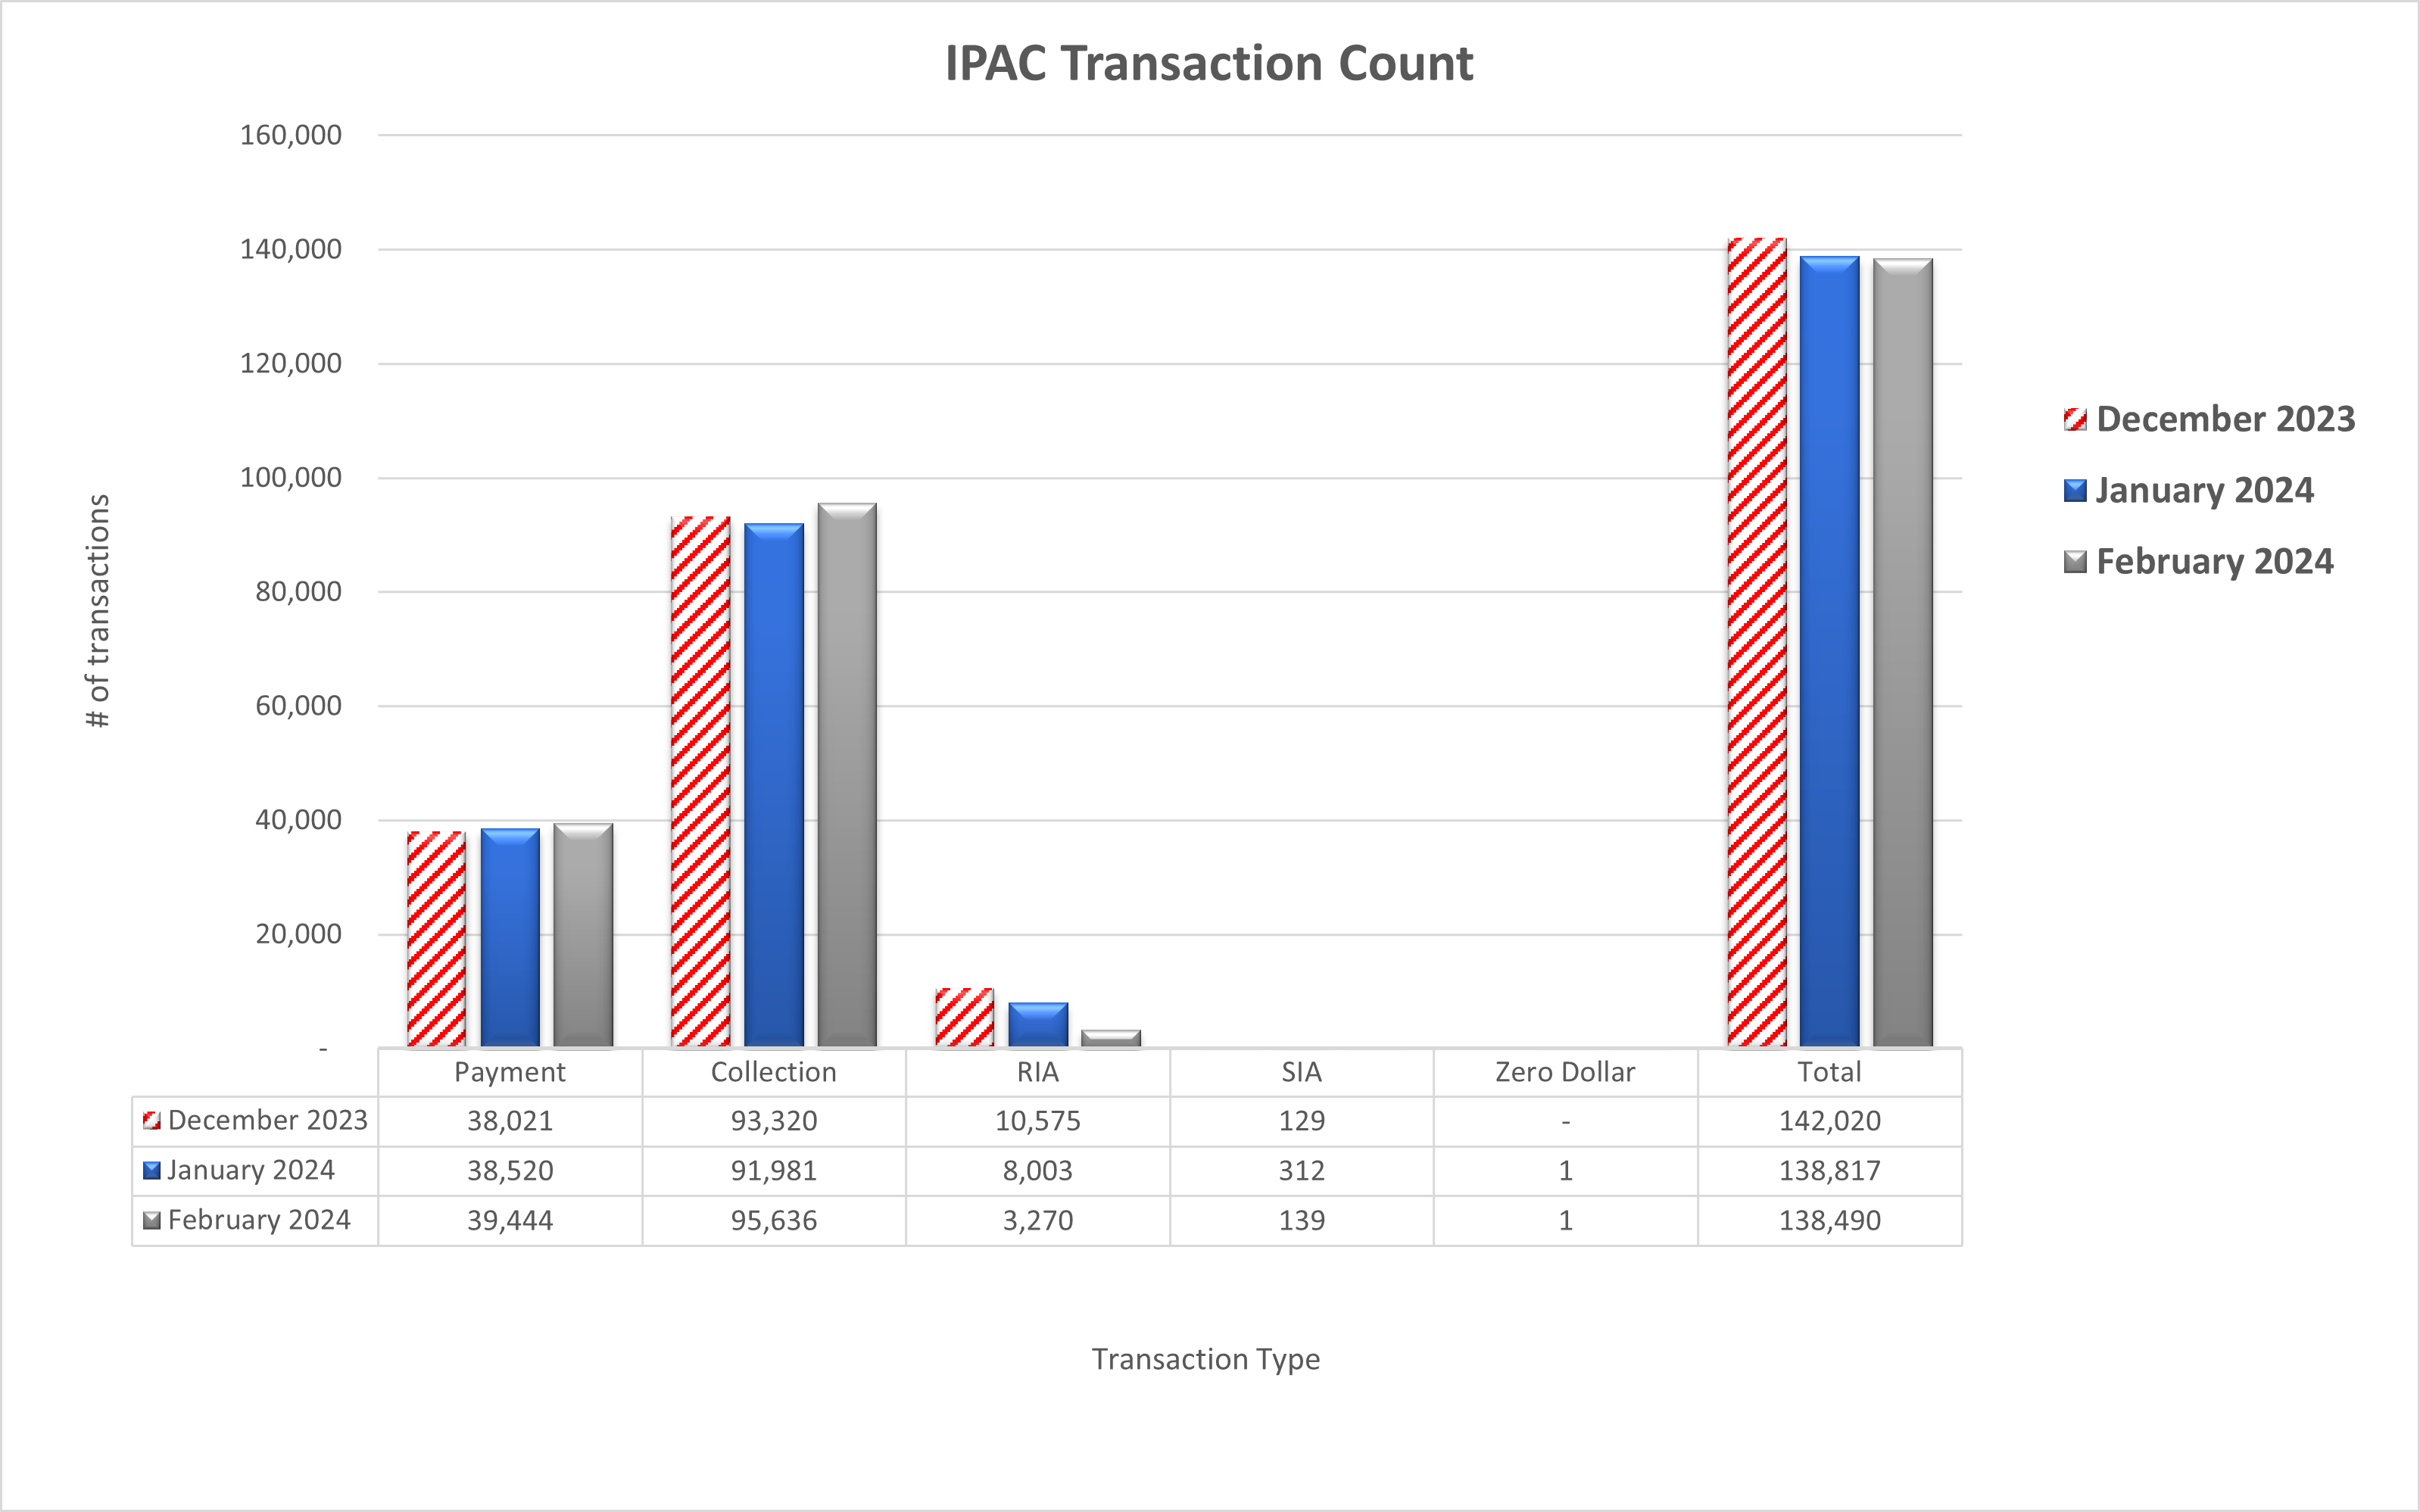
IPAC Transaction Count February 2024

Table may scroll on smaller screens
| Date | Payment | Collection | RIA | SIA | Zero Dollar | Total |
|---|---|---|---|---|---|---|
| December 2023 | 38,021 | 93,320 | 10,575 | 129 | - | 142,020 |
| January 2024 | 38,520 | 91,981 | 8,003 | 312 | 1 | 138,817 |
| February 2024 | 39,444 | 95,636 | 3,270 | 139 | 1 | 138,490 |
| Totals | 115,985 | 280,937 | 21,848 | 580 | 2 | 419,352 |
