
IPAC Transaction Count January 2020
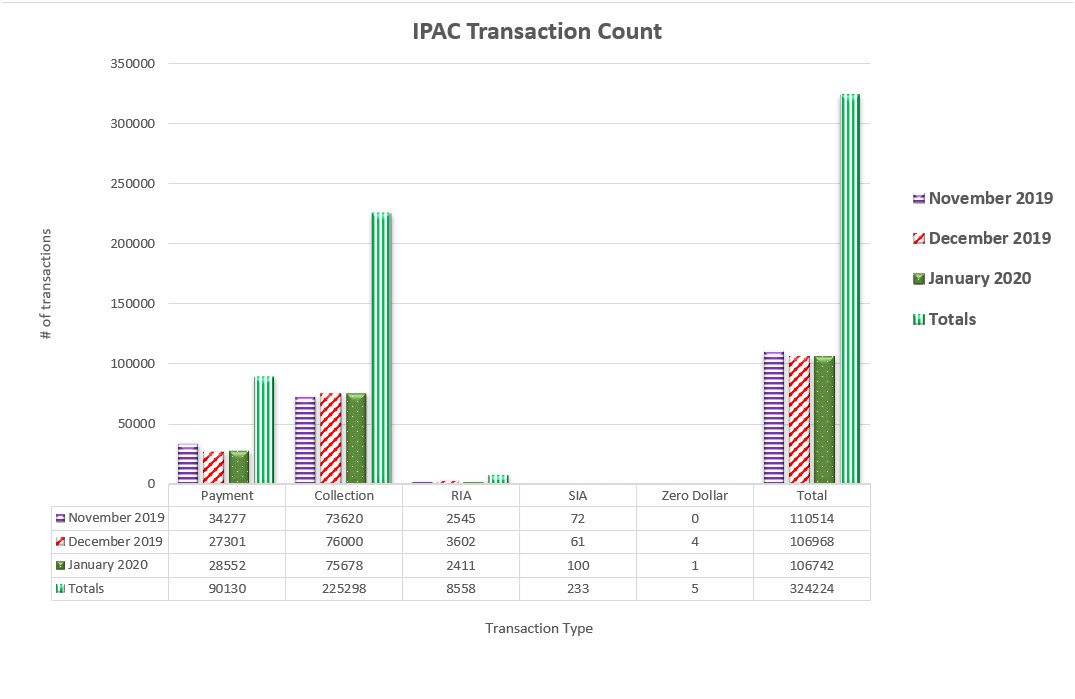
Table may scroll on smaller screens
| Date | Payment | Collection | RIA | SIA | Zero Dollar | Total |
|---|---|---|---|---|---|---|
| November 2019 | 34,277 | 73,620 | 2,545 | 72 | 0 | 110,514 |
| December 2019 | 27,301 | 76,000 | 3,602 | 61 | 4 | 106,968 |
| January 2020 | 28,552 | 75,678 | 2,411 | 100 | 1 | 106,742 |
| Totals | 90,130 | 225,298 | 8,558 | 233 | 5 | 324,224 |