
IPAC Transaction Count September 2024
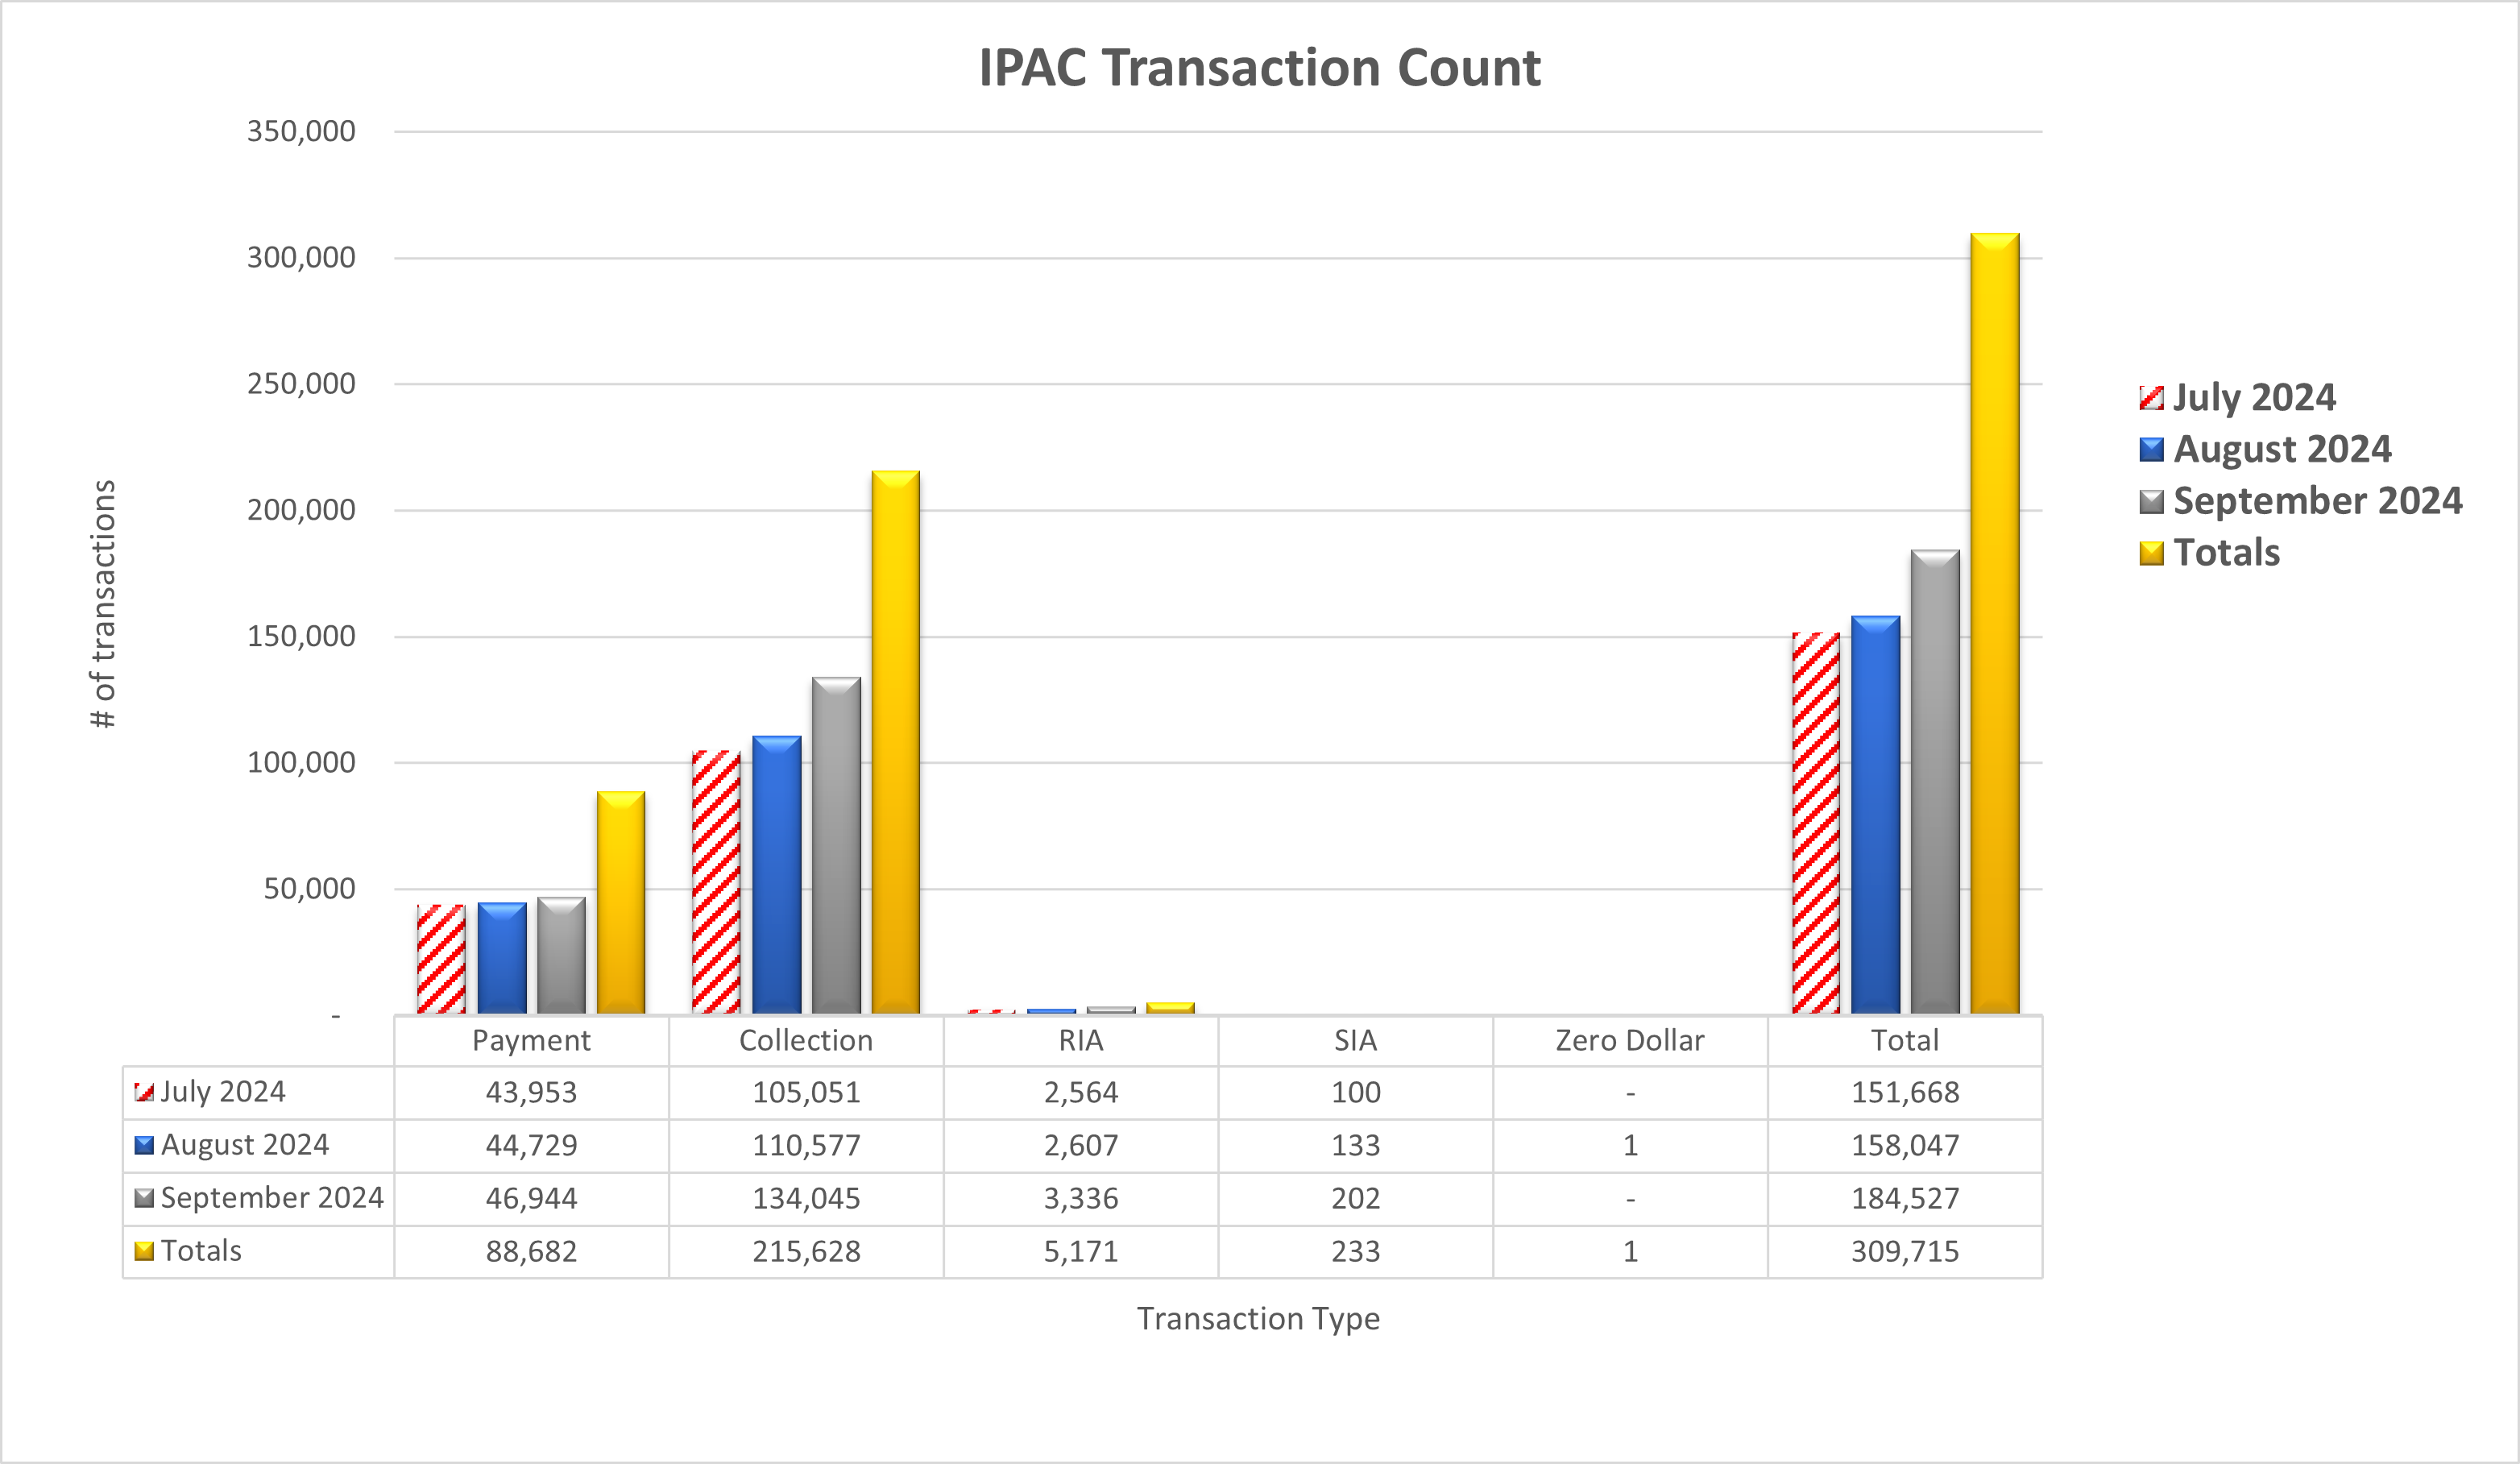
Table may scroll on smaller screens
| Date | Payment | Collection | RIA | SIA | Zero Dollar | Total |
|---|---|---|---|---|---|---|
| July 2024 | 43,953 | 105,051 | 2,564 | 100 | - | 151,668 |
| August 2024 | 44,729 | 110,577 | 2,607 | 133 | 1 | 158,047 |
| September 2024 | 46,944 | 134,045 | 3,336 | 202 | - | 184,527 |
| Totals | 88,682 | 215,628 | 5,171 | 233 | 1 | 309,715 |