
IPAC Transaction Count May 2023
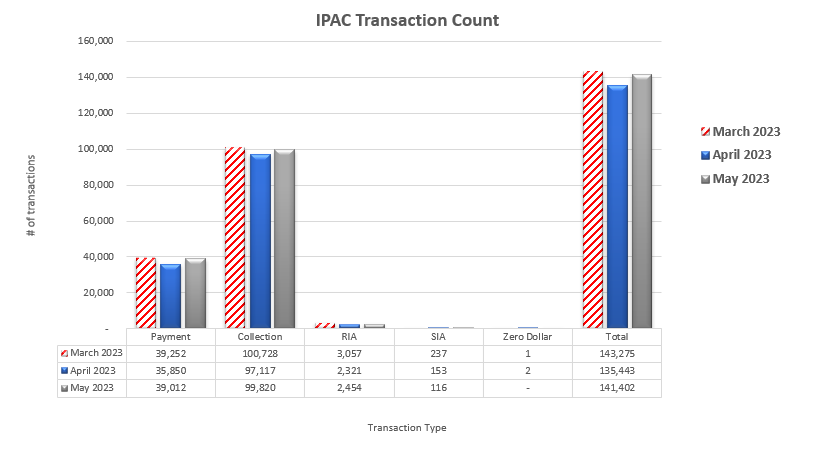
Table may scroll on smaller screens
| Date | Payment | Collection | RIA | SIA | Zero Dollar | Total |
|---|---|---|---|---|---|---|
| March 2023 | 39,252 | 100,728 | 3,057 | 237 | 1 | 143,275 |
| April 2023 | 35,850 | 97,117 | 2,321 | 153 | 2 | 135,443 |
| May 2023 | 39,012 | 99,820 | 2,454 | 116 | - | 141,402 |
| Totals | 114,114 | 297,665 | 7,832 | 506 | 3 | 420,120 |