
IPAC Transaction Count April 2022
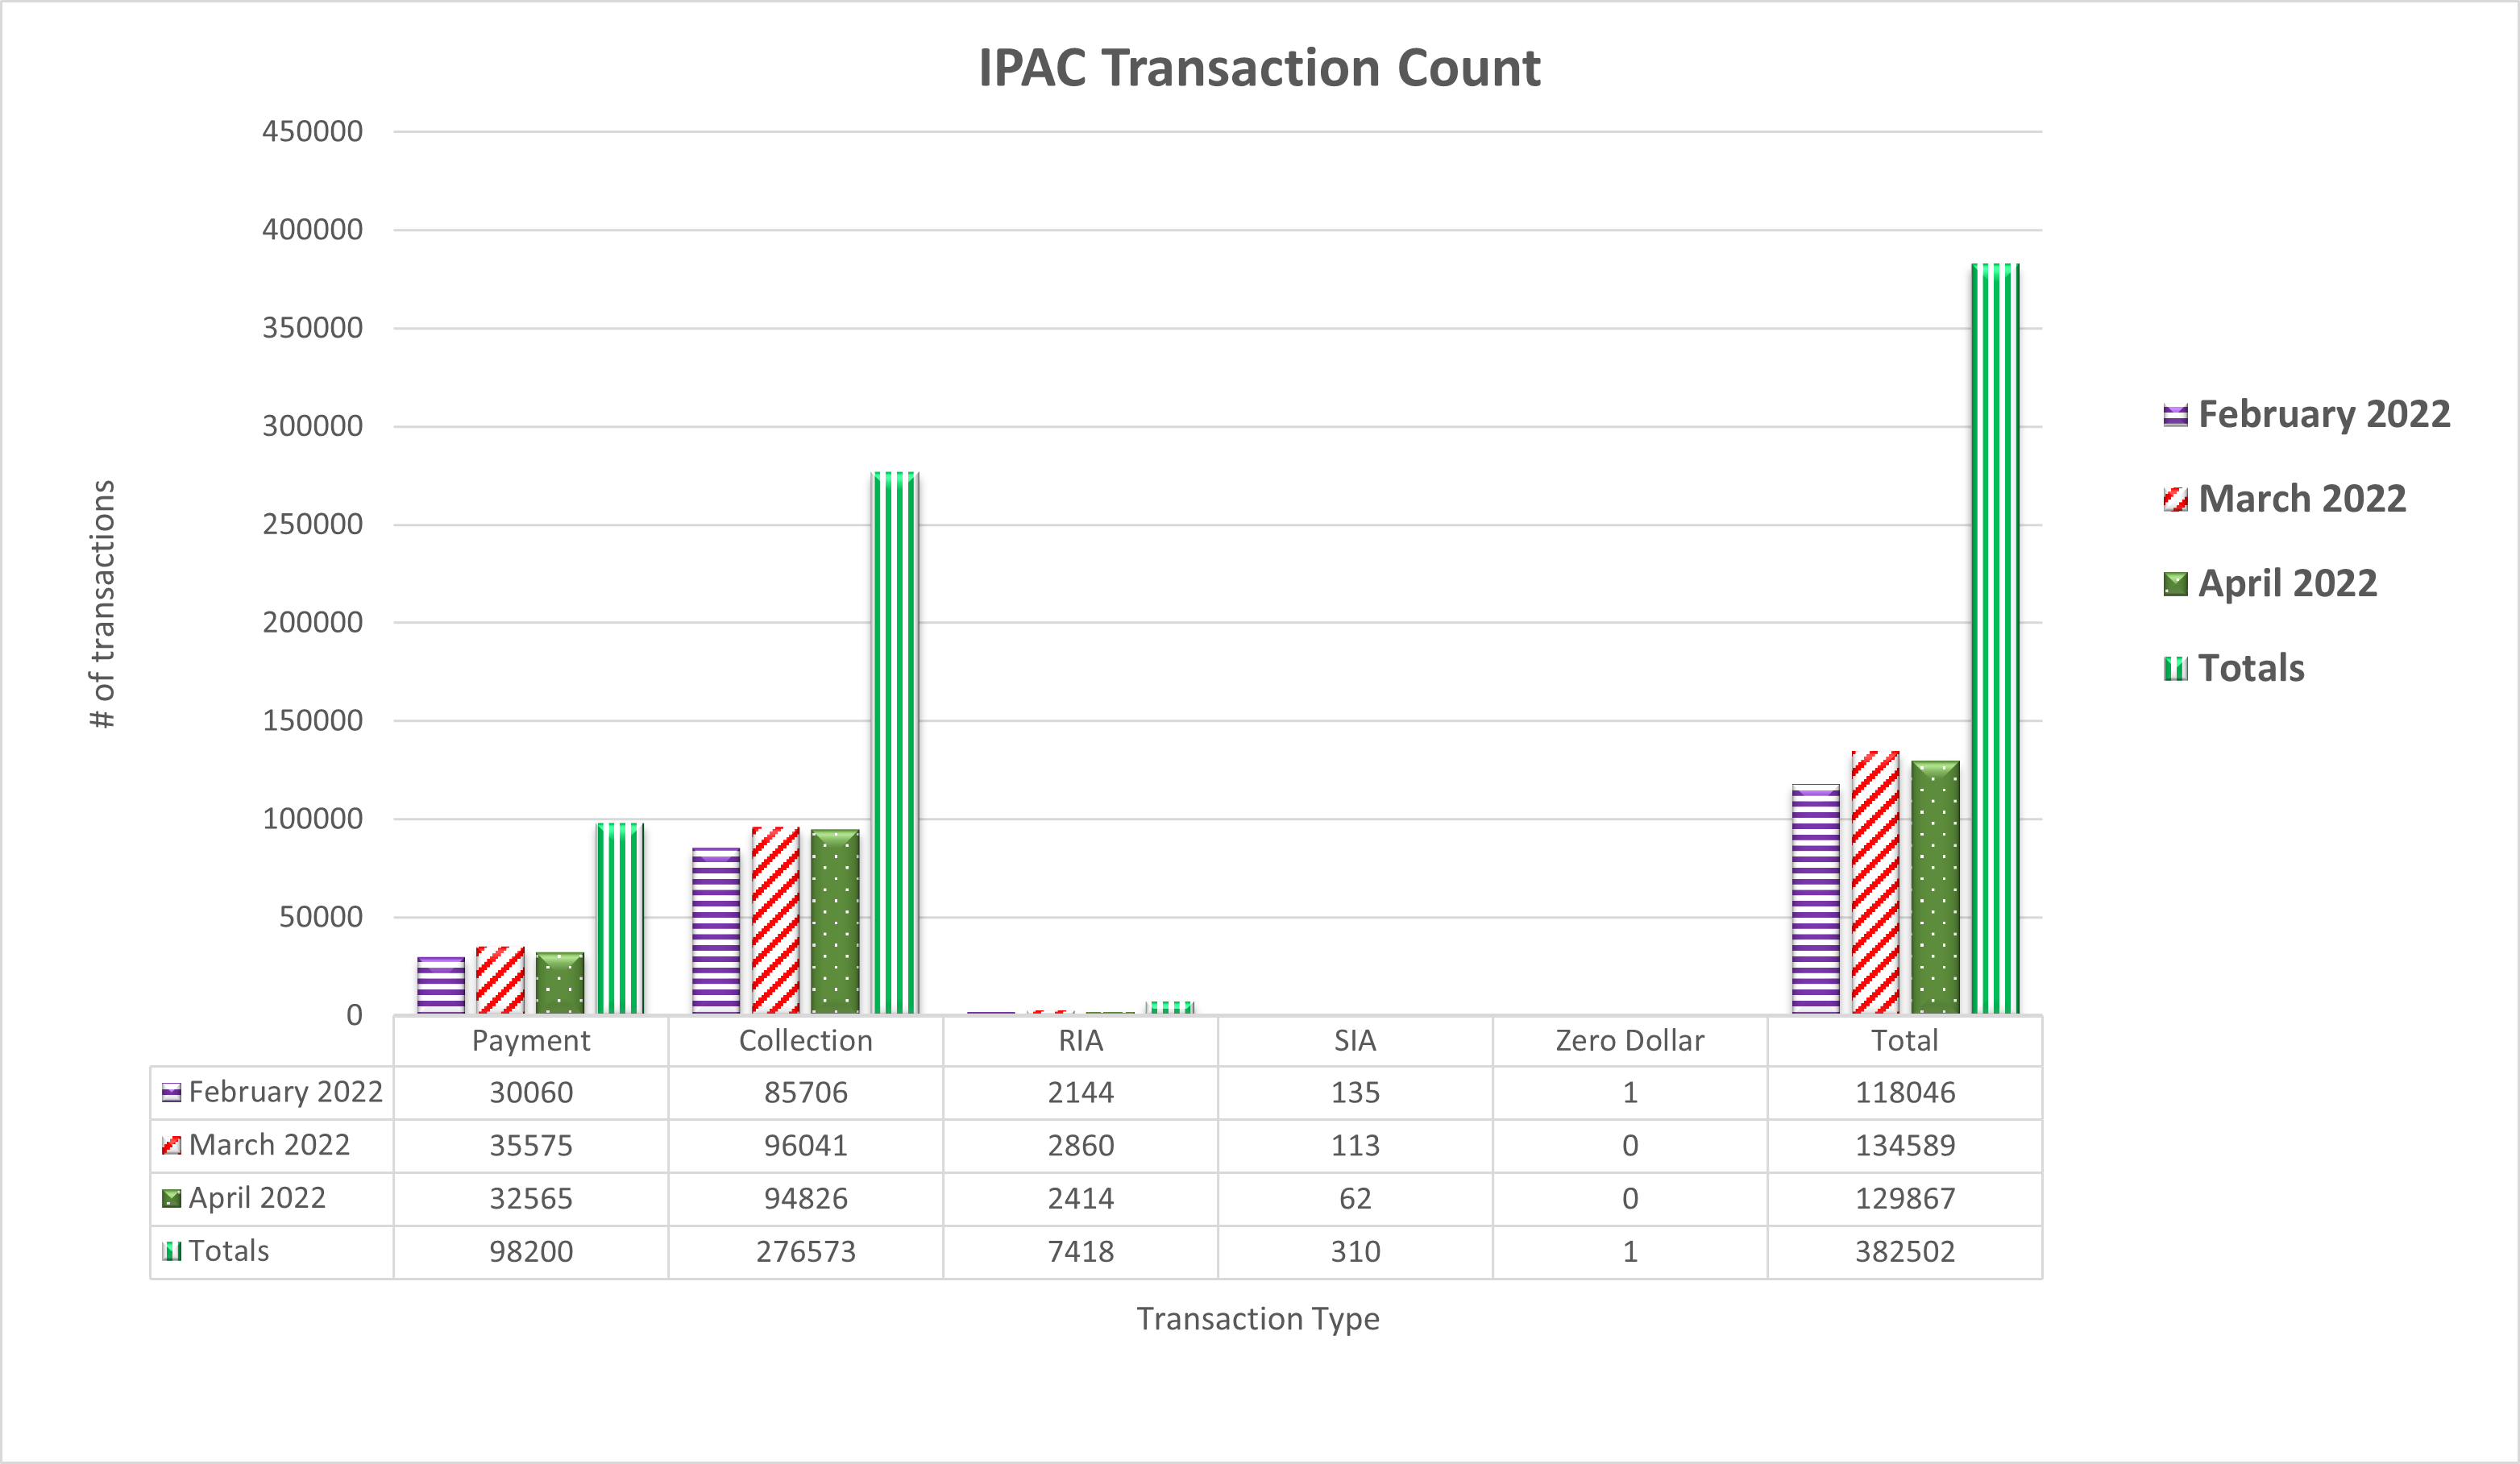
Table may scroll on smaller screens
| Date | Payment | Collection | RIA | SIA | Zero Dollar | Total |
|---|---|---|---|---|---|---|
| February 2022 | 30,060 | 85,706 | 2,144 | 135 | 1 | 118,046 |
| March 2022 | 35,575 | 96,041 | 2,860 | 113 | - | 134,589 |
| April 2022 | 32,565 | 94,826 | 2,414 | 62 | - | 129,867 |
| Totals | 98,200 | 276,573 | 7,418 | 310 | 1 | 382,502 |