
IPAC Transaction Count July 2018
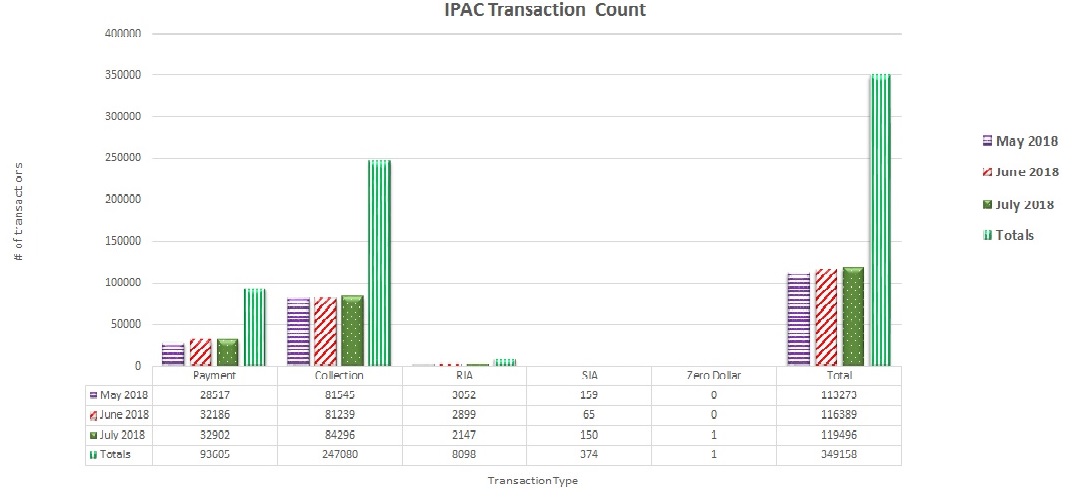
Table may scroll on smaller screens
| Date | Payment | Collection | RIA | SIA | Zero Dollar | Total |
| July 2018 | 32,902 | 84,296 | 2,147 | 150 | 1 | 119,496 |
| August 2018 | 31,738 | 92,145 | 2,000 | 212 | 1 | 126,096 |
| September 2018 | 36,929 | 112,293 | 2,798 | 293 | 1 | 152,314 |
| Totals | 101,569 | 288,734 | 6,945 | 655 | 3 | 397,906 |