
IPAC Transaction Count September 2017
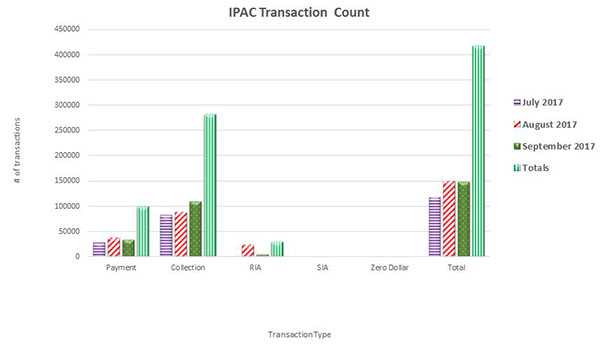
Table may scroll on smaller screens
| Date | Payment | Collection | RIA | SIA | Zero Dollar | Total |
| July 2017 | 28,831 | 82,979 | 2,112 | 81 | 0 | 118,451 |
| August 2017 | 37,747 | 89,101 | 23,646 | 143 | 0 | 150,637 |
| September 2017 | 33,499 | 110,113 | 4,680 | 170 | 148,462 | |
| Totals | 100,077 | 282,193 | 30,438 | 394 | 0 | 417,550 |